
John Casey
Lecturer, School of Business, WIT


Analysis shows there is a link between HEI resourcing and HEI performance both for Irish and UK institutions. Without an increase in resources, it is difficult to envisage how any tangible improvement in performance can result from the Technological University process. Indeed, the TU process could be counterproductive, as expectations created in key stakeholder groups may prove difficult to reach.
The Irish higher education (HE) system is about to embark on a period of significant change, with a number of institutions poised to join together to form a much smaller number of Technological Universities (TU). This is likely to be the single biggest change to the sector in a decade. However, there has been opposition to this new policy, and many institutions have been looking over the precipice for some time now.
The notion of a TU first appeared in the Hunt Report in 2011 (Hunt, 2011). While some consideration was given to the process of designation, there was scant attention directed at the funding impact of such re-designation and consequent mergers.
Perhaps it is this lack of visibility on funding that is causing the resistance to change. The present article seeks to provide insights into the relationship between funding and organisational success. It is not an attempt to discuss the broader merits of higher-education-institution mergers or HEI re-designations.
The debate on whether funding affects the success of a HEI is, remarkably, an open question. This is because there are no natural experiments in this arena. The question is further complicated by the multiple methods of resource allocation across different HE systems, and there are numerous (and contested) measures of success of HEIs. As a case in point, Liefner (2003), noting the many different approaches in use across a small (but international) sample of successful universities, concluded that ‘the link between performance-based resource allocation and the success of universities must be weak’.
However, there are many studies and reports that tend to conclude there is a positive relationship between funding and HEI success. Hazelcorn (2007) reported: ‘respondents said LTRS [League Tables and Ranking Systems, a potential measure of HEI success] were influencing key policy-making areas, e.g. classification of institutions and the allocation of funding’ – a statement that does not make claims of a causal effect, more of a linkage between ranking and funding. (The study was authored by an Irish academic but not based on Irish data.)
Numerous studies have considered particular aspects of higher-education funding. Some have analysed the efficacy of funding strategies that have attempted to incentivise HEIs to adopt certain desired behaviours, for example funding for retention and access initiatives (Hillman et al., 2015).
In recent years a growing number of studies have considered the impact of the broader political economy on higher-education funding. Many of these are US-based, however (e.g., McLendon et al., 2009), and while they make interesting policy observations, the uniqueness of the US system, or any other country, means the results are not generalisable to other jurisdictions.
The prevailing narrative on higher education spending is that Ireland values higher education and has resourced the sector accordingly. But Ireland spends less on higher education, as a percentage of GDP, than the OECD average. In 2015, the most recent year for which data is available, Ireland spent 0.8% of GDP on its tertiary education institutions, with the OECD average being 1.5% and the EU average 1.2%. This puts Ireland right at the lower end of the developed nations (OECD, 2018a), second last out of twenty-seven countries.
Could this be because Irish GDP has been inflated by asset shifting on the part of some major multinationals in Ireland? If the analysis focuses on public expenditure on tertiary education per full-time equivalent (FTE) student in 2015, the relative allocation of resources paints an improved picture – but one that might still be considered out of step with the dominant narrative. Ireland spends $13,229 per FTE student, which is at the mid-point of thirty-two countries. But this is below both the EU average of $15,656 and the OECD average of $15,998 (OECD, 2018b).
Ireland spends 3.1% of government spending on tertiary education, ranking midway (eighteenth out of thirty-five countries). This is above the OECD average of 3.0% and the EU average of 2.6% (OECD, 2018c). The reason for the above-average government spend and the below-average spend per FTE student is demographics – Ireland has a greater proportion of its population at college-going age than many other European countries.
While government spending on tertiary education does not rank Ireland very high, the benefit of being educated to honours degree level is greater in Ireland than in many other countries. If a person with just secondary education in Ireland has earnings of 100, those with an honours bachelors degree earn 167: 67% more. That puts Ireland well above the EU average of 136 and the OECD average of 144 (OECD 2018d), sixth out of twenty-nine countries in the education premium ranking. This could be considered an apparent contradiction – or could it indicate the need for further education, beyond Leaving Certificate, in order to ‘succeed’ in Ireland? Indeed, for female students, Ireland ranks highest in terms of the private net financial returns of attaining tertiary education compared with returns to upper-secondary education (OECD, 2018e).
In summary, relative to the rest of the developed world, Ireland does not spend more on higher education. In fact, Ireland could be considered to spend slightly less than the average country, depending on the dimension used. However, the private returns to higher education beyond a secondary-school education are more pronounced in Ireland than in most other countries.
In Ireland the funding for higher education operates on a two-tiered system. The universities attract the majority share of resources, while the institute of technology (IoT) sector operates at a much lower level of funding. This is true in terms of the total resources available to the university sector and the resources available on an FTE student basis (see table).
Resourcing of Ireland’s HEIs1
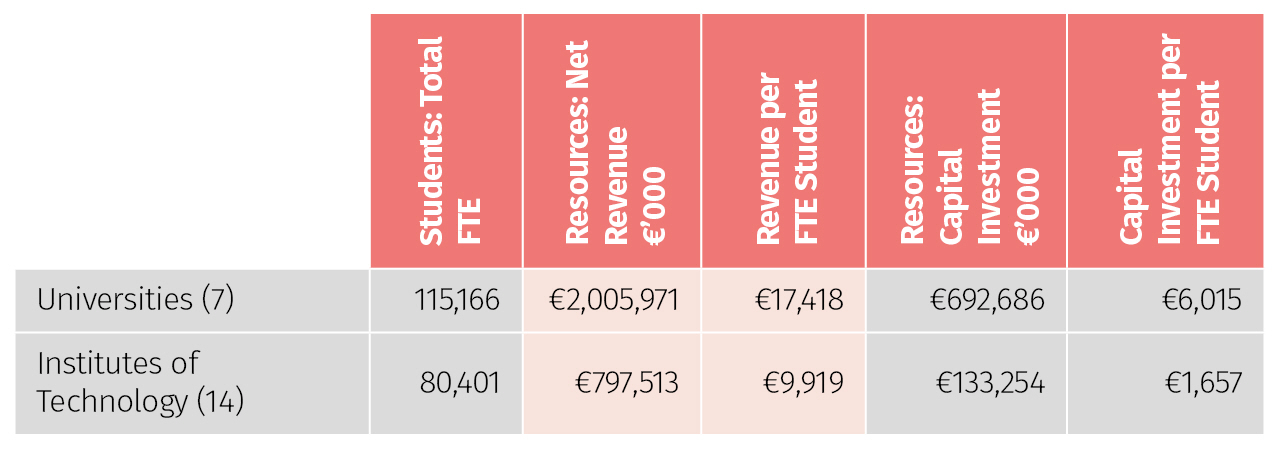
The disparity in resources across the sectors is considerable: 75% greater funding goes to the university sector on an FTE student basis. There is an even greater disparity in capital funding. Much of this has occurred because in recent years the universities have accessed debt to fund capital projects. The total borrowings and capital commitments of the university sector are almost €1 billion, according to the universities’ most recently available audited financial statements.
The two-tiered resource system leads to considerable challenges for the IoT sector in terms of student recruitment and service provision. The cost to the individual of attending a HEI is the same for both sectors. Even ignoring any other differences, it is clear to see why a student might select a university over an IoT. Each student attending university gets an effective additional subsidy from the government. The additional capital and recurring funding provided to the university sector has an impact – this is not an unreasonable conclusion, otherwise the greater allocation of resources to the university sector would be difficult to justify – hence the student recruitment advantage that is afforded to the universities.
[ctt template=”2″ link=”bcfEG” via=”no” ]Whether funding affects the success of a HEI is, remarkably, an open question.[/ctt]
The TU project could be seen as an attempt to remedy this disparity and at the same time address some of the regional higher-education imbalances. To date, however, very little additional funding has been promised. This is an important aspect of the TU argument: the prevailing narrative is that the new TUs will have a transformative impact on their regions (see final section below). At issue is whether this impact can be achieved on current resources, or whether combining existing IoTs into TUs will require significant additional resources to achieve the promised outputs.
It is reasonable to question the requirement for additional funding for these organisations: Do greater levels of funding to HEIs lead to improved organisation performance?
Measuring ‘performance’ is a challenge. One approach is to consider the ranking systems as a proxy. This is open to the charge that the rankings are flawed measures, and there is considerable literature on this. But university presidents appear to believe there is a strong association between ranking and university performance:
Many other examples could be provided of university presidents and equivalents offering reasons why their university has fallen or risen on a particular ranking scale. Resources are often a key part of any explanation.
There are numerous organisations that purport to offer university ranking systems. Many of the systems are global, reflecting the growing international nature of higher education. From an Irish perspective the ranking systems can be divided into two categories:
While the ranking systems all use different methodologies, the results are broadly consistent: Trinity is the highest-ranked Irish institution, although the precise global ranking number can differ.
Based on the national ranking systems that rank all the HEIs (n = 21), the correlation between ranking and revenue per full-time equivalent student is high, over −0.78, indicating a strong negative correlation between funding and ranking.2 This is true for a variety of correlations tested using both the product moment correlation coefficient and the Spearman’s rank correlation coefficient. In all cases the coefficient was statistically significant at the 1% level of significance.
This would indicate a strong relationship between funding and ranking. But correlation coefficients are abstract. Consider the following: the average revenue per FTE student for the top three ranked institutions is €20,383 (same for all ranking lists), whereas the equivalent for the bottom three is €9,172 (using the Sunday Times list for 2018, but the differences are minor for the other ranking lists).
It is a similar tale for the international ranking systems. Recall that these apply only to the university sector (and DIT), so the sample size is small: eight institutions. Again, the correlation between ranking and revenue per full-time equivalent student is strong: over −0.87. This is true for a variety of correlations tested using both the product moment correlation coefficient and the Spearman’s rank correlation coefficient. In all cases the coefficient was statistically significant at the 1% level of significance.
[ctt template=”2″ link=”caHp4″ via=”no” ]Without an increase in funding, it is difficult to see how any tangible improvement in performance can result from a TU.[/ctt]
Even on the international ranking lists, the disparity in funding per FTE student is correlated with the ranking obtained. On a more concrete basis, the top three ranked universities have an average revenue per student of €20,383, with the other four universities reporting an average of €14,277. The average ranking of the top three universities is in the low 200s, while the average for the other four is in the low 500s.3
There does appear to be a link between funding (as measured by revenue per FTE student) and organisational performance (as measured by various ranking systems). However, there are other considerations:
Perhaps a consideration of the UK higher-education system will help to produce more robust results on the nature and extent of the link between funding and organisational performance.
The higher education sector in the UK is considerably larger than in Ireland. The original sample of 147 institutions was reduced to 131 for this analysis due to a lack of a full set of data. Institutions that did not offer undergraduate education (e.g., Cranfield University) were also excluded.
Student enrolment data was obtained from the Higher Education Statistics Agency (HESA) for the academic year 2016–17. Funding information was obtained from the audited annual financial statements of the institutions for the year ended 31 July 2017 (all HEIs in the UK have adopted a similar financial year end). There are numerous UK-only ranking systems: the Complete University Guide Ranking System was used here. The ranking systems are broadly similar: the same universities appear at the top of all the ranking systems.
[ctt template=”2″ link=”OaI4h” via=”no” ]Without a funding model, the TU could be counterproductive[/ctt]
There is considerable disparity across the UK higher education sector in terms of the size of an institution (based on enrolments), the revenue per institution, and the revenue per student. However, the average revenue per student is £15,500: similar to the Irish university sector (using an exchange rate of 0.88). But the UK funding per student is over €7,000 higher than the average funding per student in the Institute of Technology.
The correlation coefficient between funding per FTE student and university ranking in the UK is similar to Ireland: the Spearman’s rank correlation coefficient is −0.75. The correlation coefficient is significant at the 1% level.
Again, to make the argument less abstract: the top twenty ranked universities in the UK had an average revenue per student of £28,450, whereas the bottom twenty had an income per student of £9,127. The chart below shows the distribution of income per full-time equivalent student when the universities are sorted by their ranking. It is clear that the highest-ranked universities are funded to a much greater extent than the lowest-ranked universities.

Figure 1: Distribution of average revenue per FTE student by rank decile (n = 131; 13 per decile). UK Universities
In the UK, the data suggests a strong relationship between the funding of a university and its success based on its ranking position.
Without an increase in funding, it is difficult to see how any tangible improvement in performance can result from a TU. This does imply a relationship between performance and funding, in opposition to one of the caveats above. An alternative argument is: If significant benefits can be realised by simply merging and re-designating existing institutions, then why wasn’t this done decades ago?
This may impact on the better-performing IoTs/TUs from challenging the traditional university sector – the TU could be a process of averaging out the better-performing IoTs with weaker IoTs to create a ‘mediocracy’.
[ctt template=”2″ link=”1w799″ via=”no” ]There is a strong relationship between HEI funding and organisational success – but we can make no claims on causality.[/ctt]
The TU process is unlikely to resolve the regional economic imbalances and regional under-provision of higher education. Indeed, it might make the situation more difficult, as the expectations of local stakeholders are raised without giving the institutions the resources to deliver on the promises made on their behalf. The Munster Technological University website (www.mtu.ie) says, ‘MTU graduates will experience enhanced employability both in Ireland and internationally’, while the Technological University of the South East website (www.tuse.ie) says:
It will provide leadership as the cohesive force at the centre of knowledge, research and innovation in the region and will also facilitate an external focus allowing the region to capitalise on other economic drivers, nationally and internationally. It will cultivate future generations of active and engaged citizens across the South East and will be a driver of social inclusion, social justice and of cultural and artistic activity in the coming decades.
This paper has shown there is a strong relationship between HEI funding and organisational success. However, we can make no claims on causality.
Unless there is a step change in the funding model, it is difficult to argue for any tangible improvement in performance from a TU.
Indeed, without a funding model, the TU could be counterproductive. The increased expectations created in key stakeholder groups will be difficult to reach, undermining the credibility of the institution.
Carolan, M. (2017) ‘Trinity College climbs up global university rankings’, Irish Times, 5 September.
Hazelkorn, E. (2007) ‘The impact of league tables and ranking systems on higher education decision making’, Higher Education Management and Policy, 19(2), 1–24.
Hillman, N.W., Tandberg, D.A., and Fryar, A.H. (2015) ‘Evaluating the impacts of “new” performance funding in higher education’, Educational Evaluation and Policy Analysis, 37(4), 501–19.
Hunt, C. (2011). National Strategy for Higher Education to 2030. Report of the Strategy Group, January 2011. Dublin: Government Publications.
Kehm, B.M. (2014) ‘Global university rankings: Impacts and unintended side effects’, European Journal of Education, 49(1), 102–12.
Liefner, I. (2003) ‘Funding, resource allocation, and performance in higher education systems’, Higher Education, 46, 469.
McLendon, M.K., Hearn, J.C., and Mokher, C.G. (2009) ‘Partisans, professionals, and power: The role of political factors in state higher education funding’, Journal of Higher Education, 80(6), 686–713.
Murray, S. (2017) ‘Irish universities make gains in list of the world’s top colleges’, TheJournal.ie, 8 June.
OECD (2018a) ‘Indicator C2 What proportion of national wealth is spent on educational institutions?’, in Education at a Glance 2018: OECD Indicators. Paris: OECD Publishing.
OECD (2018b) ‘Indicator C1 How much is spent per student on educational institutions?’, in Education at a Glance 2018: OECD Indicators. Paris: OECD Publishing.
OECD (2018c) ‘Indicator C4 What is the total public spending on education?’, in Education at a Glance 2018: OECD Indicators. Paris: OECD Publishing.
OECD (2018d) ‘Indicator A4 What are the earnings advantages from education?’, in Education at a Glance 2018: OECD Indicators. Paris: OECD Publishing.
OECD (2018e), ‘Indicator A5 What are the financial incentives to invest in education?’, in Education at a Glance 2018: OECD Indicators. Paris: OECD Publishing.
Ryan, Ó. (2018) ‘Fall of Irish universities in world rankings “disappointing but not a surprise”’, TheJournal.ie, 6 June.
Saunders, M., Lewis, P., and Thornhill, A. (2009) Research Methods for Business Students, 5th edn. Pearson Education Ltd.
Copyright © Education Matters ® | Website Design by Artvaark Design